How to read the report
Example 1
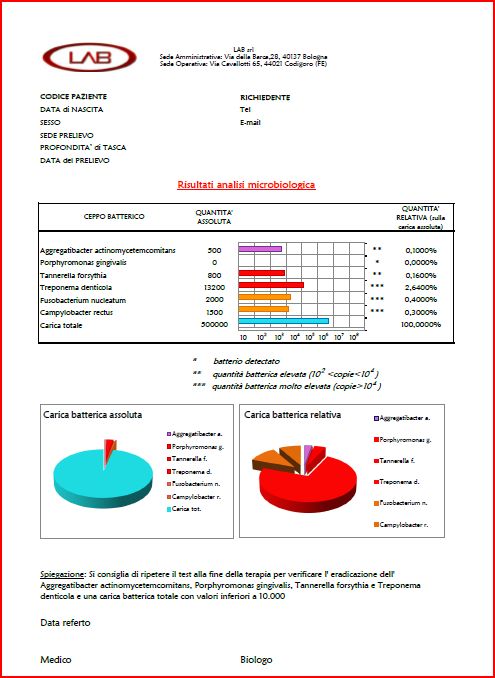
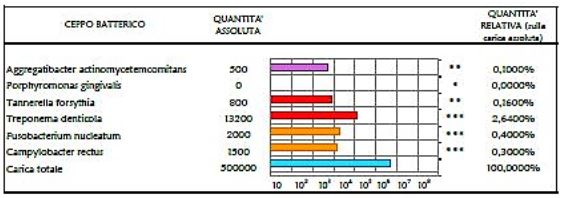
The first image of the report is an horizontal bar graph in logarithmic scale. The first factor that must be considered is the total bacterial loading (i.e. the blue bar). When the blue bar is less than 10,000 it means that patient has a “controlled bacterial quantity” and periodontium is healthy. In the reported example the total bacterial load is 500,000 that is much higher than 10,000 units. This means that patient is far from an ideal situation of oral hygiene.
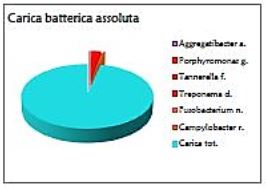 The second graph, left round chart, reports the bacterial absolute value expressed in numbers. Red slice correspond to pathogens of example 1. It is visually small and corresponds to the sum of the percentages given in the right column of the previous bar graph (0.1 + 0.16 + 2.64 + 0.4 + 0.3 = 3.6%). The relationship between periodontal-pathogenic bacteria and total bacterial load is important because usually the higher is the percentage of pathogens greater will be the acuteness of the pathology. Similarly to what happens with the use of probiotics to the intestinal flora, the presence of “good” bacteria creates an ecosystem unfavourable to the development of aggressive species, and vice-versa.
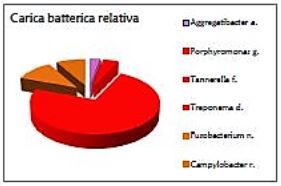 The third graph (i.e. red round chart on the right) provides a visual representation of the relative percentages of periodontal pathogens which are conventionally divided into 3 groups: 1) Aggregatibacter Actinomytetemcomitans, 2) Red complex and 3) Orange complex.
1-Aggregatibacter Actinomytetemcomitans’ role is discussed in the recent international literature and clinician should choose the most appropriate therapy according to national guidelines, international protocols and his own clinical experience with chemical, physical and mechanical medical devices.
2-Red complex is the most relevant bacterial index of active periodontal disease and, among them, Treponema Denticola is the most important.
3-Micro-flora of the oral cavity and periodontal pockets is similar to a coral reef where there are several species evolving dynamically. Orange complex has a low pathogenic action on periodontium but it supports the action of red complex thus becoming a negative factor for periodontal disease evolution.
Example 2
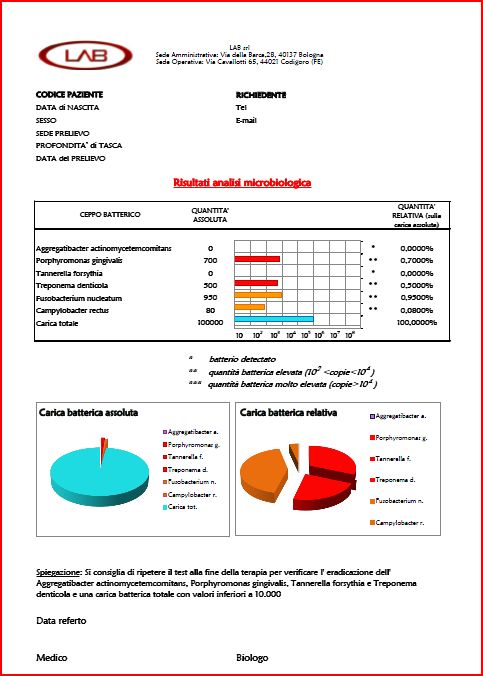
Example 2 is a paradigm of chronic periodontal disease. The patient is not able to clean by itself, in fact, the total bacterial load is 100. 000 (that is more than 10,000).
The percentage of periodontium-pathogens is not so high. In fact the sum of pathogen’ percentages (0.7 + 0.5 + 0.95 + 0.08) is 2.23% (see blue round chart). Clinically a patient with this bacterial profile has a chronic periodontitis in which there are pockets but probably no abscess.
The bacterial test therefore shows that although the disease appears in a state of quiescence, it is essential to establish appropriate therapy to reduce the total bacterial count and eradicate the red complex.
In the red round graph the “red complex” is more than half of pathogens and there is no Aggregatibacter Actinomytetemcomitans.
Therapy will be based on clinical and microbiological results. Clinical experience and guidelines will direct the therapeutic plan. (For example, what is the cause of high bacteria loading ? If there are deep periodontal pockets, they should be treated with appropriate tools).
Example 3
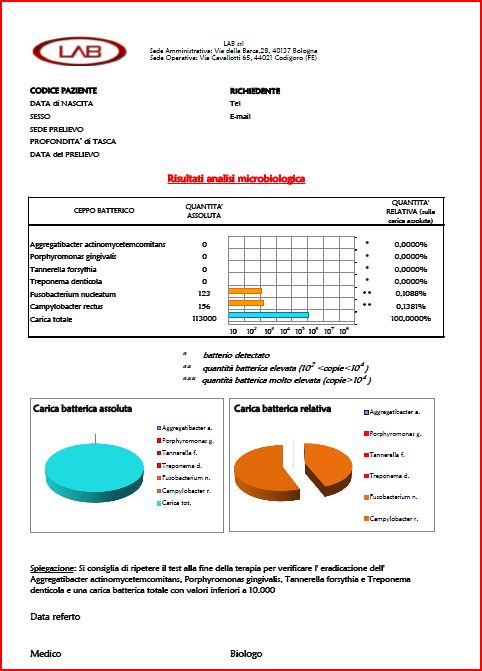
This patient has no pathogens but an high total bacterial count. The patient is not able to maintain an adequate oral cleaning at home although he has no marker of active periodontal disease. He must be recruit in a protocol of frequent professional hygiene recall.
Example 4
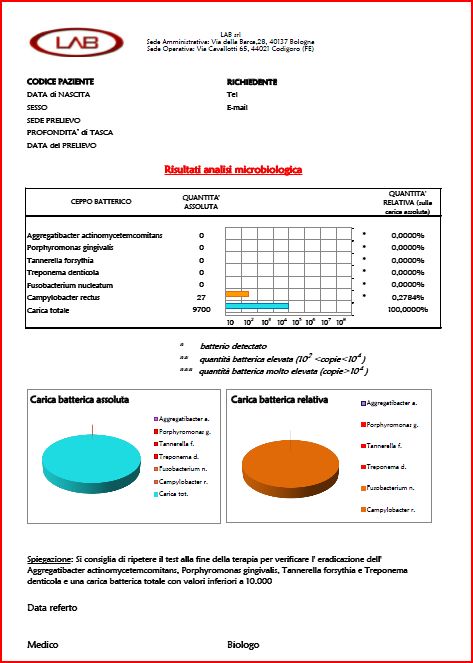
Patient is “clean” since the total bacterial count of less than 10,000. This report can be the result of a periodontal therapy well conducted or the natural output of a patient able to have a proper oral hygiene at home.
Example of Genetic Test
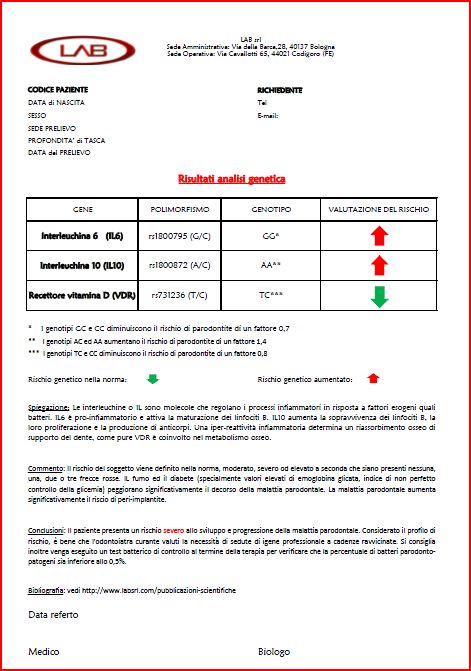
Some genes known to be involved in periodontal disease (according to the international literature) are used to assess the risk of periodontal disease in a clinically healthy patient (i.e. an orthodontic patient with a family history of periodontal disease). Gene haplotypes are used.
What is an haplotypes? A gene encoding for a character (i.e. the colour of eyes) may have different haplotypes (i.e. gene sequence) which correspond to different phenotypes (i.e. blue, black, brown, etc.). Some haplotypes are related to a statistically significantly increased risk of periodontal disease. This are called “association studies”.
From studies of populations it was possible to calibrate the increased risk (as reported by arrows in the report). Since the degree of interaction between different genes is not known, it is estimated the risk of periodontal disease simply as the algebraic sum of single factors.
It’s necessary to emphasize that the report is a genetic laboratory test. The risk assessment can only be provided by an integrated study of familiar (family tree), genetic testing, bacterial load, systemic diseases (i.e. diabetes) and habits (i.e. smoking). This integrated report can be delivered only by doctor (not by a laboratory) since periodontitis is a multi-factorial disease (influenced by many external and internal factors) and polygenic (where multiple genes are involved at the same time).
Genetic test are used to identify genetic risk factors in healthy patients. This is useful to establish a “primary prevention” (i.e. a prevention performed in absence of disease) by using protocols of professional hygiene and microbiological tests.
